> >
Cape Town luxury suburbs hit record highs against the trend

Cape Town Luxury Suburbs Hit Record Highs Against the Trend: Why Scarcity Assets Become a Haven for Overseas Investors

Introduction: Record Highs Against the Trend Are the Real Confidence Signal

In Q1 2026, South Africa faced slowing GDP growth, a SARB repo rate held at 7.00%, and persistent rand volatility. Yet in Cape Town’s Southern Suburbs, a counter-intuitive phenomenon is unfolding: Bishopscourt’s average price broke through R 30M, Constantia Upper reached R 26M, and Kenilworth Upper gained over 220% in five years.

Higher prices on lower volumes is not an anomaly—it is the pricing mechanism of scarce assets. When global economic uncertainty rises, capital flows toward prime locations with zero supply—the underlying market logic every overseas property investor must understand.
The Uppers: Full 2026 Counter-Trend Data

AreaAvg. Price 2020/2021Avg. Price Q1 20265-Year GrowthDistinguishing Feature
BishopscourtR 11MR 30MNearly 3xOne of South Africa’s strongest luxury markets, only 300+ homes
Constantia UpperR 12MR 26MOver 2xHistoric vineyards, mature tree-lined avenues
Kenilworth UpperR 5.6MR 18MOver 220%Upper-tier location, steady high-net-worth demand
NewlandsR 6MR 14MOver 2xQuality school district, convenient living
Claremont UpperR 6MR 11MNearly 2xNear medical centres, favoured by professionals

Data source: Seeff Property Group / Lightstone PropStats, Q1 2026

Key finding: transaction volume fell 17% year-on-year in Q1 2026, yet total transaction value held at about R 860 million while average prices kept setting new highs. This means fewer listings are being snapped up at higher prices—supply scarcity is accelerating the rise in the price floor.

Why Do Economic Headwinds Push Luxury Prices Higher?

Zero Supply Elasticity: Table Mountain Locks the Ceiling

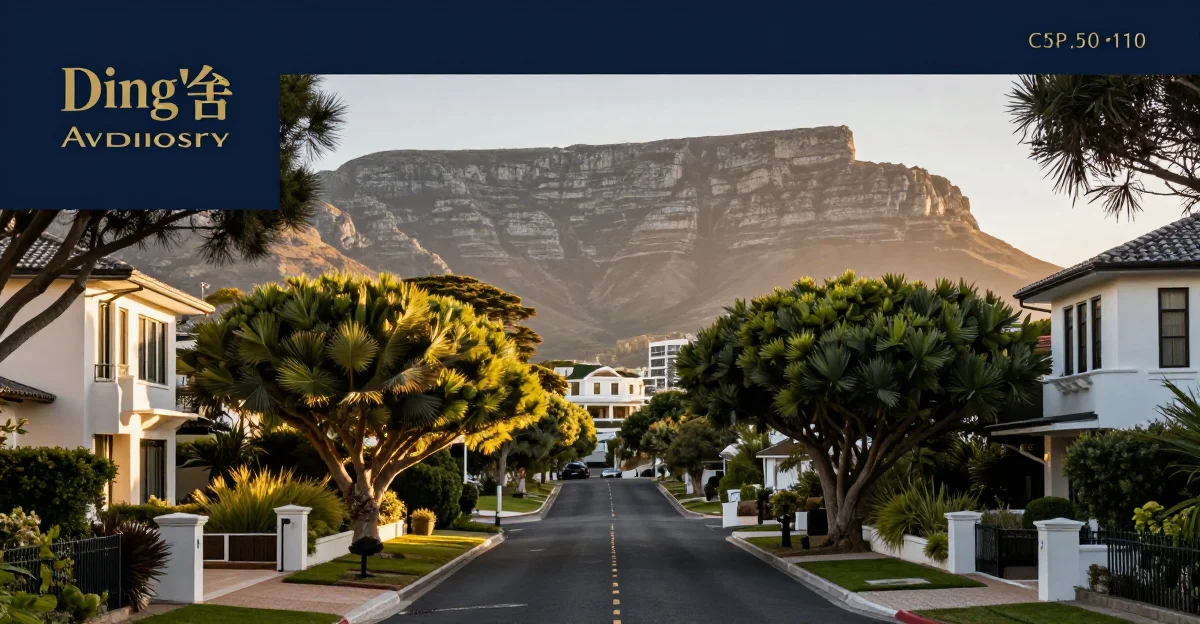
The geographic boundaries of the Uppers are formed by Table Mountain National Park and Kirstenbosch Botanical Garden, leaving almost no developable land. Listings halved year-on-year in Q1 2026—not because demand shrank, but because there is no new supply left to list.

When supply is zero, any increment in demand translates directly into higher prices. This is not speculation, but value accumulation driven by physical constraints.

Semigration Continues to Inject High-Net-Worth Demand

According to StatsSA data, roughly 319,000 people moved into the Western Cape on a net basis between 2021 and 2026, many of them high-net-worth professionals from Gauteng. They bring proceeds from selling property in Gauteng and enter Cape Town’s premium market at a relatively low cost. During economic downturns, semigration actually accelerates—because Gauteng’s infrastructure strains are greater, speeding up the “flee to Cape Town” trend.

Global Capital Seeks Scarce Safe Havens

When the global economy is uncertain, capital does not stop investing—it flows toward assets whose supply cannot be diluted. The Uppers’ zero supply elasticity makes them a shared safe haven for both South African and international capital. This explains why global economic headwinds and record Uppers prices are occurring simultaneously.

The Price Floor Is Rising: Timing the Entry

The Uppers data reveals a clear trend: the price floor keeps rising.

  • Bishopscourt rose from R 11M to R 30M, nearly 3x in five years
  • Claremont Upper rose from R 6M to R 11M, nearly 2x
  • Newlands rose from R 6M to R 14M, over 2x
This means every year of waiting narrows the window for entering the Uppers lifestyle circle with the same budget. Claremont Upper’s current average of R 11M sits right within the R 10,450,000 property budget—but this window will not stay open forever.

The R 16,000,000 Structured Plan: Enter Before the Price Floor Climbs Further

DingYao’s Phase 1 South Africa property programme, with its R 16,000,000 entry threshold, offers a complete structure for entering the Uppers value band:

  • Property purchase price of R 10,450,000—secures quality stock in Claremont Upper or Newlands, capturing the capital growth from the same school districts and lifestyle, plus 8-10% fully-let income (income is earned only when rented; not a guaranteed fixed return)
  • Associated costs of about R 550,000—transfer, legal, trust formation, etc.
  • R 5,000,000 in a Standard Bank Wealth savings account—6.5% compounded daily, paid monthly, for an effective annual rate of about 6.72%
Dual-engine cash flow:
  • Rental engine: R 10,450,000 × 8-10% = R 836,000 - R 1,045,000/year
  • Interest engine: R 5,000,000 × 6.5% compounded daily, paid monthly ≈ R 335,000+/year
  • Total annual cash flow: R 1,171,000 - R 1,380,000
The hidden engine: while you wait, the full R 16,000,000 begins earning interest immediately in the lawyer-held trust protection account—about R 86,000 per month (roughly R 2,849 per day). Your capital is never idle from day one.

Conclusion: The Counter-Trend Rise of Scarcity Assets Is an Entry Signal

Cape Town’s Uppers have hit record prices amid global economic uncertainty—not a bubble, but the natural result of zero supply and structurally growing demand. With each year of waiting, the average prices of Claremont Upper and Newlands rise, and the window that R 10,450,000 can buy keeps narrowing.

The R 16,000,000 structured plan lets overseas investors enter before the price floor climbs further, delivering a stable dual-engine cash flow of R 1,171,000 - R 1,380,000/year while capturing capital-appreciation potential.

Overseas investment, overseas property—when scarce assets hit new highs amid economic headwinds, the best time was yesterday, and the second-best time is today.

Scott Huang

Scott Huang

Business Development — Specializing in Cape Town premium property investment and cross-border wealth management for Asia-Pacific high-net-worth individuals.

Start Your Cape Town Property Journey

Schedule a one-on-one consultation with our team to explore premium investment opportunities in Cape Town's most resilient markets.

Consultation