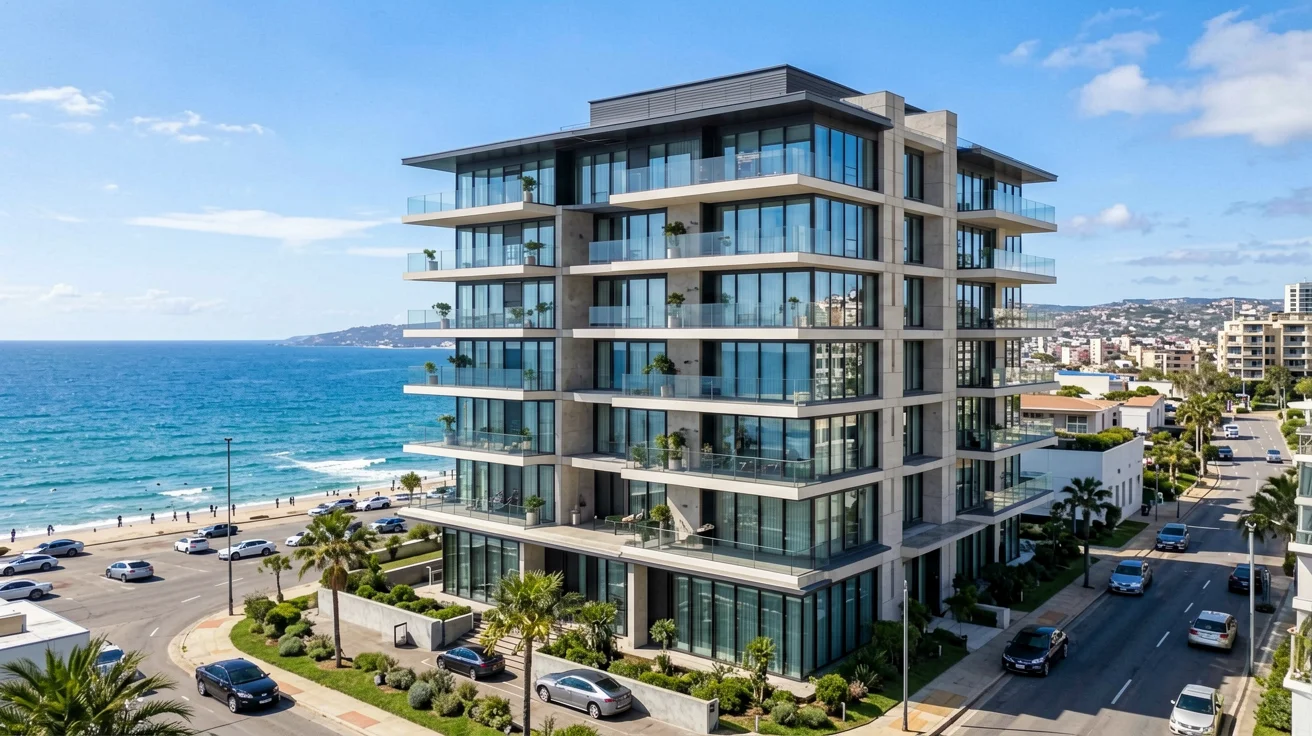
When overseas investors evaluate overseas property opportunities, the most critical question is always: 'Can my property maintain a high occupancy rate? How much actual income will I earn?' In 2026, Cape Town's rental market delivered a convincing, data-driven answer: premium Western Cape properties maintain occupancy rates stable in the 92-96% range, with an average vacancy period of just 2-4 weeks. The forces driving this — the 'semigration' wave and the international remote-work trend — are reshaping South Africa's rental landscape.



The R 16,000,000 Phase 1 Plan: From Data to Decision
DingYao Advisory's R 16,000,000 Phase 1 plan converts Cape Town's rental-market strengths into calculable cash flow:
Core of the Plan
| Item | Amount | Description |
|---|---|---|
| Entry threshold | R 16,000,000 | Total investment |
| Property purchase | R 10,450,000 | Premium property in a core area |
| Transaction costs | R 550,000 | Transfer duty, legal fees, etc. |
| Standard Bank Wealth current account | R 5,000,000 | 6.5% annual interest, compounded daily |
| Annual cash flow (conservative) | R 1,171,000 | Rent R836K + interest R335K |
| Annual cash flow (optimistic) | R 1,380,000 | Rent R1.05M + interest R335K |
Why Cape Town's Occupancy Rate Is Key
This plan assumes an occupancy rate of 92-96%. If occupancy falls to 80%, annual rental income would drop from R836,000 to R680,000 (about an 18.7% cash-flow loss). Cape Town's semigration trend and remote-work demand reduce this risk to extremely low levels.