> >
Cape Town property demand: semigration, international buyers, and bank competition as triple drivers

Cape Town Property Demand Unpacked: Who Is Buying and Why — Semigration, International Buyers, and Bank Competition as Triple Drivers | DingYao Advisory

Introduction: A Rate Hike Is Not Negative News — It’s a Touchstone

On 28 May 2026, the SARB’s Monetary Policy Committee (MPC) voted 4 to 2 to raise the repo rate by 25 basis points to 7.00%, lifting the prime rate to 10.50%. Four members backed the hike and two opposed it. Inflation forecasts were revised up: from 3.7% to 4.4% for 2026 and from 3.3% to 3.7% for 2027, while the 2026 economic-growth forecast was cut from 1.4% to 1.2%.

By the textbook, rate hikes should cool house prices — higher borrowing costs mean fewer buyers and lower prices. But Cape Town’s market data shows this rule does not apply here. In fact, the hike has become a touchstone of Cape Town’s structural resilience: while other markets cool as rates rise, Cape Town’s scarcity-driven growth continues.

The SARB Hike in Full: The Deep Logic Behind the May Decision

The Details of the Decision

The MPC’s decision was not made lightly. The four members favouring a hike focused on the upside risk to inflation — the 2026 forecast was revised from 3.7% to 4.4%, close to the top of the SARB’s 3-6% target band. The two opposing members argued that slower economic growth (from 1.4% down to 1.2%) calls for more accommodative monetary policy.

The next MPC meeting will be held on 23 July 2026. The market broadly expects that if inflation data keeps beating forecasts, the SARB may hike further. But whatever the rate path, Cape Town’s structural demand drivers appear unaffected by short-term monetary policy.

Market Reaction: Mortgage Costs Rise, but Cash Transactions Dominate

Following the hike, the prime rate rose to 10.50%, raising monthly repayments on variable-rate mortgages. But this impact is sharply muted in Cape Town’s premium market — because 82% of premium property transactions are cash deals (BetterBond/FNB data). For those buyers, rate changes barely influence their purchase decisions.

This is a key structural feature of the market: Cape Town’s premium segment is not mortgage-driven but supported by cash buyers, semigration capital, and international capital alike. This renders the traditional “rate hike → cooling” transmission channel ineffective here.

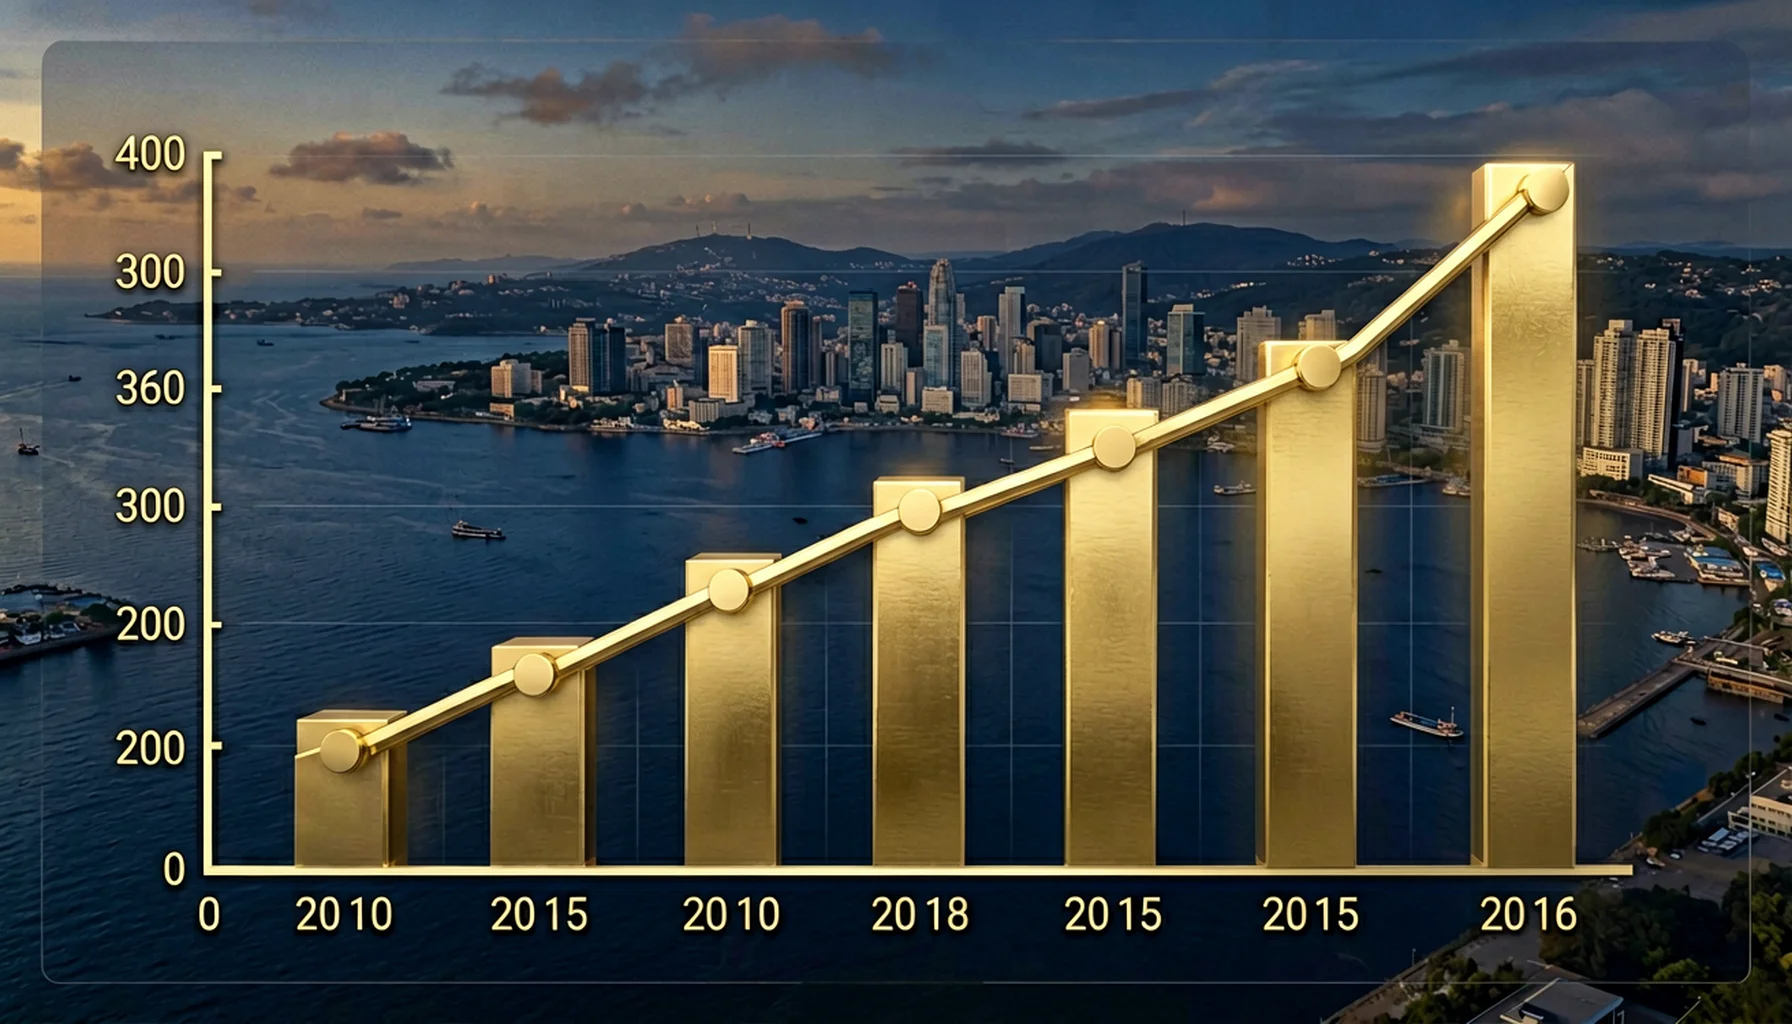
Cape Town Price Resilience: The Truth Behind 8-10% Annual Growth

The Africanvestor Latest Data (Updated 19 June 2026)

The Africanvestor’s latest report offers a detailed picture of Cape Town’s price growth:

MetricData
Cape Town Average House Price~R 2,600,000 (all property types)
Average Price per m²~R 28,000/m²
12-Month Price Growth**~11%** (City of Cape Town metro index)
Full-Year 2026 Forecast Growth**8-10%** (range 6-12%)
5-Year Forecast Nominal Growth45-60%
10-Year Forecast Nominal Growth110-150%

Regional Growth Rankings: Where Are Gains Strongest?

AreaAnnual GrowthDriver
Sea Point & Green Point**12-15%**Waterfront living, international buyers, short-term rental demand
Woodstock & Salt River9-12%Urban renewal, influx of young professionals
Claremont & Rondebosch8-11%School districts, hospitals, transport hubs

Sea Point and Green Point lead the city at 12-15% annual growth — these two waterfront areas have long been the top choice of international buyers. Woodstock and Salt River have become the fastest-growing inner-city districts thanks to urban renewal and an influx of young professionals. Claremont and Rondebosch deliver steady growth on the strength of quality school districts and healthcare resources.

Appreciation by Property Type: Townhouses Lead

  1. Townhouse — 10-13% annual appreciation (security, parking, low maintenance)
  2. Apartment — 8-11%
  3. Condo / sectional title — 7-10%
  4. Villa — 5-8% (higher price point, smaller buyer pool)

Townhouses lead all property types at 10-13% annual appreciation — an important signal for overseas investors: a townhouse, with high security, convenient parking, and low maintenance costs, is not only suited to remote management but also the option with the greatest appreciation potential.

Why Rate Hikes Cannot Crush Cape Town: Four Structural Supports

1. Extreme Supply Scarcity

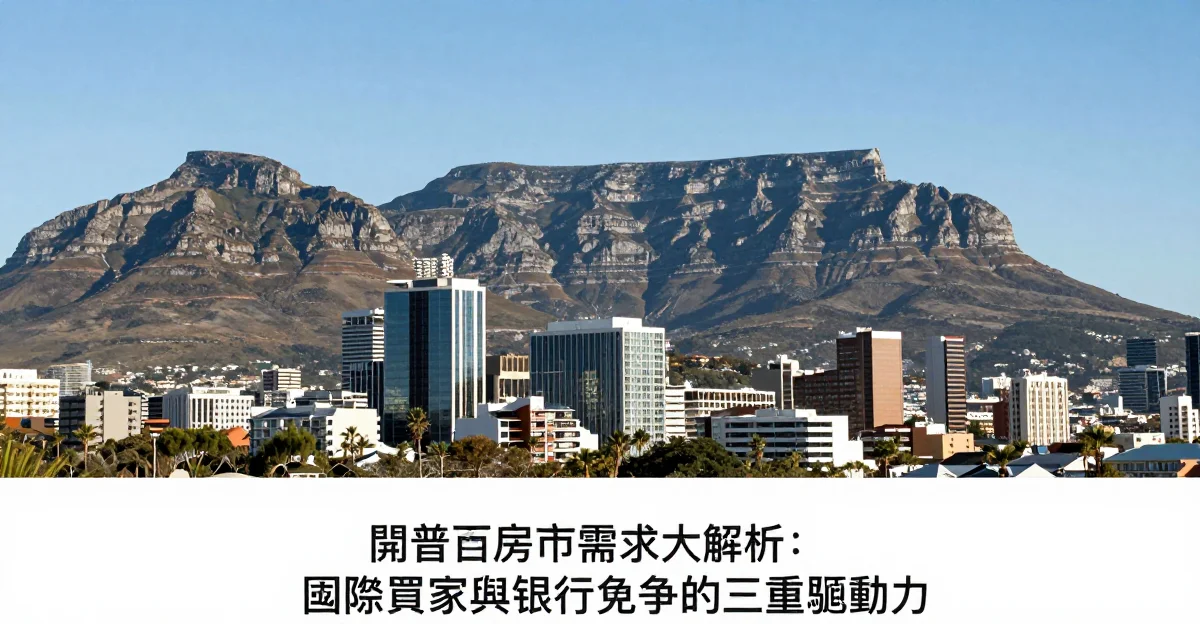
Cape Town’s geography sets its supply ceiling: bounded by the Atlantic Ocean to the west and Table Mountain National Park to the east, developable land is extremely limited. Slow municipal approvals and infrastructure constraints keep new supply near zero. Property24 data shows Cape Town listings fell from 6,584 to 5,759 units in the six months from December 2025 to May 2026, a decline of 12.5%.

2. Cash Transactions Dominate the Premium Market

As noted, 82% of premium property transactions are cash deals. This means rate changes have a negligible effect on the premium segment. When most buyers do not need financing, a rate hike loses its traditional cooling effect.

3. Semigration Keeps Flowing In

According to StatsSA data, roughly 319,000 people migrated net into the Western Cape between 2021 and 2026, many of them high-net-worth professionals. BetterBond reports that the Western Cape remains the top semigration destination, with 80% of Cape Town sellers re-buying locally. These semigrants enter the Cape Town market in cash with the proceeds of Gauteng home sales.

4. International Buyers Stay Bullish

Cape Town’s international appeal stems not only from its natural beauty and quality of life but also from its relative price advantage. Compared with global cities such as London, New York, and Sydney, premium Cape Town property still trades at a value discount. Combined with the rand at historic lows (USD/ZAR at about 18:1 versus a historical average of 14:1), international buyers enjoy a currency discount of roughly 20-30%.

The Rental Market Is Strongly Positive Too

Yield Data

AreaYield TypeYieldSource
City Bowl 1 BedroomNet Yield7.5-7.9%The Africanvestor (May 2026)
Northern SuburbsGross Yield7-9%KiliCasa (Apr 2026)
Southern SuburbsGross Yield5.5-7%SA Property Tools (Jun 2026)

The strength of the rental market provides a second layer of support for price growth: high yields mean investors can “service the mortgage with rent” or earn steady cash-flow returns, further enhancing the investment appeal of Cape Town property.

The Time Cost for Overseas Investors: The Price of Waiting

At an 8-10% annual growth rate, every year of waiting adds R 1,280,000-R 1,600,000 to the R 16,000,000 entry cost. This is not a theoretical number — it is Cape Town’s current actual pace of growth.

For investors considering overseas property, this means time itself is a cost. The earlier you enter, the lower your entry price and the sooner you begin accumulating rental income and price appreciation.

The Phase 1 Plan: Positioning Within Growth

DingYao’s Phase 1 plan offers a complete, structured investment package:

ItemAmountDescription
Total InvestmentR 16,000,000Entry threshold
Property Purchase PriceR 10,450,000Premium Cape Town property
Related Costs~R 550,000Transfer, attorney, trust setup, etc.
Post-Transfer Call DepositR 5,000,000Standard Bank Wealth call account

Dual-Engine Annual Cash Flow:

  • Rental Engine: R 10,450,000 × 8-10% = R 836,000 - R 1,045,000/year (fully-let income; income requires occupancy)
  • Interest Engine: R 5,000,000 × 6.5%, compounded daily and paid monthly ≈ R 335,000+/year (effective annual rate ≈ 6.72%)
  • Total Annual Cash Flow: R 1,171,000 - R 1,380,000

Adding 8-10% annual price growth (roughly R 1,280,000-R 1,600,000/year), the combined annual return is substantial.

Attorney-Trust Protection: overseas investors’ funds are protected under South African law from day one. Before transfer, the full purchase price is held in an attorney-trust account and already accruing interest. The client’s money is never idle — even before the property is transferred, the funds are generating a return.

Conclusion: The Rate Hike Confirms Cape Town’s Resilience

The SARB’s hike is not negative news for the Cape Town market but a touchstone that confirms its structural resilience. While other markets cool as rates rise, Cape Town’s scarcity-driven growth continues. For overseas investors this means two things: first, the long-term appreciation logic of Cape Town property remains intact; second, the cost of waiting is rising by R 1,280,000-R 1,600,000 every year.

It is time to seriously consider investing in Cape Town property.

Frequently Asked Questions (FAQ)

Q: Will the SARB keep raising rates?

A: The next MPC meeting will be held on 23 July 2026. If inflation data keeps coming in above expectations, the SARB may hike further. But regardless of the rate path, Cape Town’s structural demand drivers (scarce supply, cash-led transactions, semigration, and international buyers) are unaffected by short-term monetary policy.

Q: Can the 8-10% annual price growth persist?

A: The Africanvestor forecasts nominal growth of 45-60% over five years and 110-150% over ten. Given Cape Town’s supply constraints and sustained demand growth, this trajectory carries high credibility over the medium term.

Q: How do overseas investors ensure the safety of their funds?

A: DingYao’s attorney-trust protection structure ensures that overseas investors’ funds are protected under South African law from day one. The full purchase price is held in an attorney-trust account and begins accruing interest before transfer.

Q: Is it already too late to enter now?

A: At an 8-10% annual growth rate, waiting a year means paying an extra R 1,280,000-R 1,600,000. The Cape Town market is still in its structural-growth phase, and entering now still offers significant long-term appreciation potential.

References and Data Sources

  1. The Africanvestor — Cape Town price forecasts (updated 2026-06-19): https://theafricanvestor.com/blogs/news/cape-town-price-forecasts
  2. The Africanvestor — Cape Town property market analysis: https://theafricanvestor.com/blogs/news/cape-town-real-estate-market
  3. The Africanvestor — Cape Town rental yields: https://theafricanvestor.com/blogs/news/cape-town-rental-yields
  4. Trading Economics — SARB interest-rate data: https://tradingeconomics.com/south-africa/interest-rate
  5. Private Property — industry reaction to the rate hike: https://www.privateproperty.co.za/advice/news/articles/property-industry-reacts-to-latest-interest-rate-hike/9689
  6. Prospr Real Estate — Cape Town property market overview: https://prospr.realestate/blog/cape-town-property-market-overview
  7. KiliCasa — South Africa rental-yield analysis 2026: https://insights.kilicasa.co.za/en/en-rental-yields-south-africa-2026-cape-town-jhb-pta-durban/
  8. SA Property Tools — rental yields by city: https://sapropertytools.co.za/blog/rental-yield-by-city.html
  9. BetterBond — semigration trends report: https://www.betterbond.co.za/learn/semigration-trends-shift-from-lifestyle-choices-to-strategic-property-decisions/
  10. PropFlow360 — South Africa property market analysis 2026: https://www.propflow360.co.za/blog/south-african-property-market-2026
Scott Huang

Scott Huang

Business Development — Specializing in Cape Town premium property investment and cross-border wealth management for Asia-Pacific high-net-worth individuals.

Start Your Cape Town Property Journey

Schedule a one-on-one consultation with our team to explore premium investment opportunities in Cape Town's most resilient markets.

Consultation